
Last 7 Days Chart
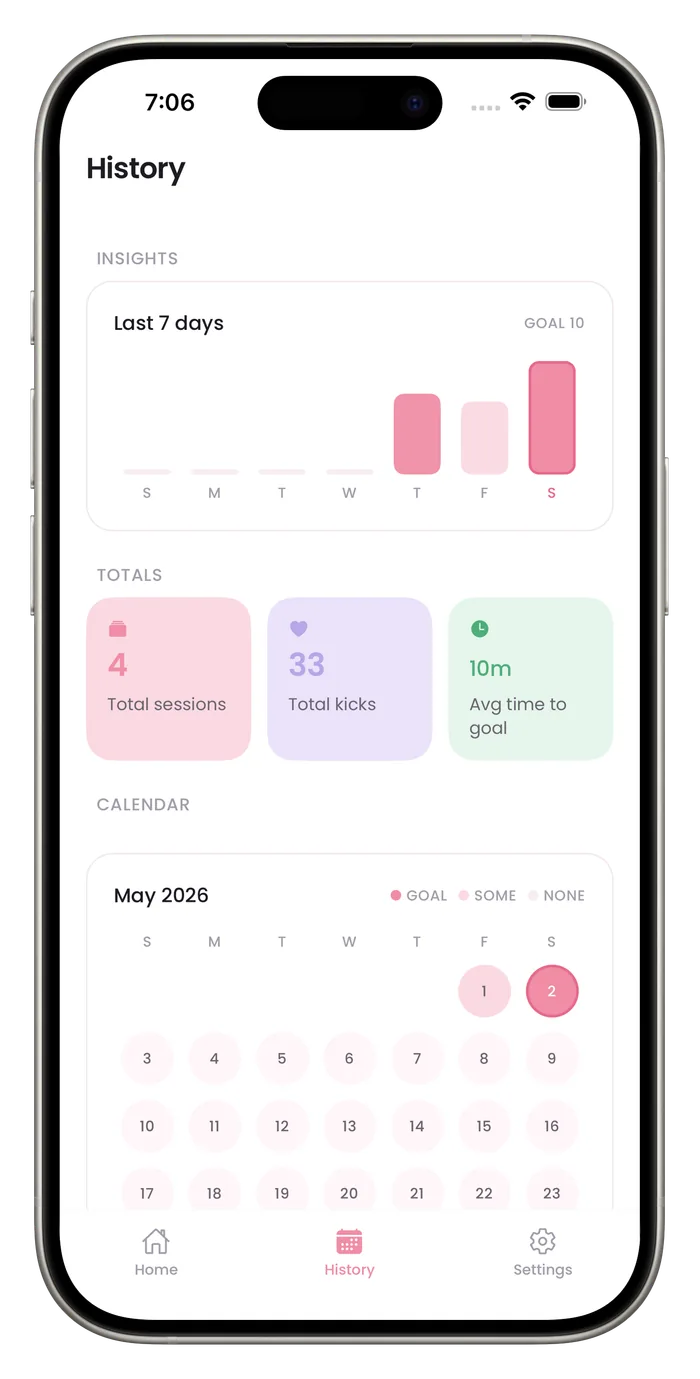
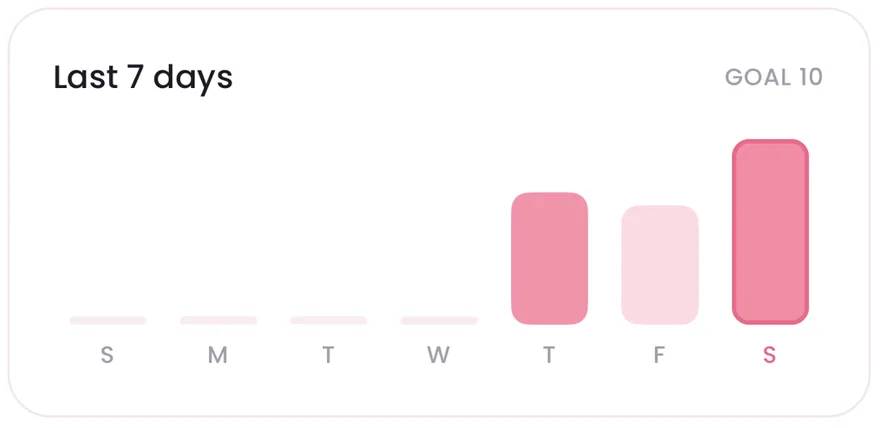
The History tab shows your last 7 days as a bar chart with your goal marked, and bars that reach it are a darker pink. Totals for sessions, kicks and average time to goal appear further down the same tab. The chart draws only what you logged, so a quiet day can mean fewer sessions as well as fewer kicks.

What the chart and totals show
Seven bars and a goal
One bar per day for the last week, with your goal shown in the corner of the chart. A bar is darker pink when that day's kicks reach the goal.
Totals at a glance
Total sessions and total kicks cover all your saved sessions. Average time to goal counts only the sessions that reached your goal.
Built from your own entries
Nothing is estimated. A day with no saved session shows an empty bar.
Questions about this feature
How far back does the chart go?
Seven days. For older days, use the calendar, which shows the current month. The sessions list shows only your 8 most recent sessions.
Does the chart tell me whether my baby is well?
No. It shows the counts you recorded and nothing more. If a pattern worries you, or movements feel different from usual, contact your midwife, doctor or maternity unit.
Start a daily record today.
Bumpi Kicks keeps a simple log of your kick counts that you can look back on and show your care team.
Free to download. Counting needs a Pro subscription, and the App Store paywall shows the price and any free trial before you pay.